Reference Ranges
CueMate provides reference ranges to help users interpret their metrics. The reference ranges indicate the desirable range of values for the various metrics.
A key feature of CueMate is its ability to account for different player subgroups (see below) to describe the appropriate performance expectations based on player individual factors and skill levels.

Overview
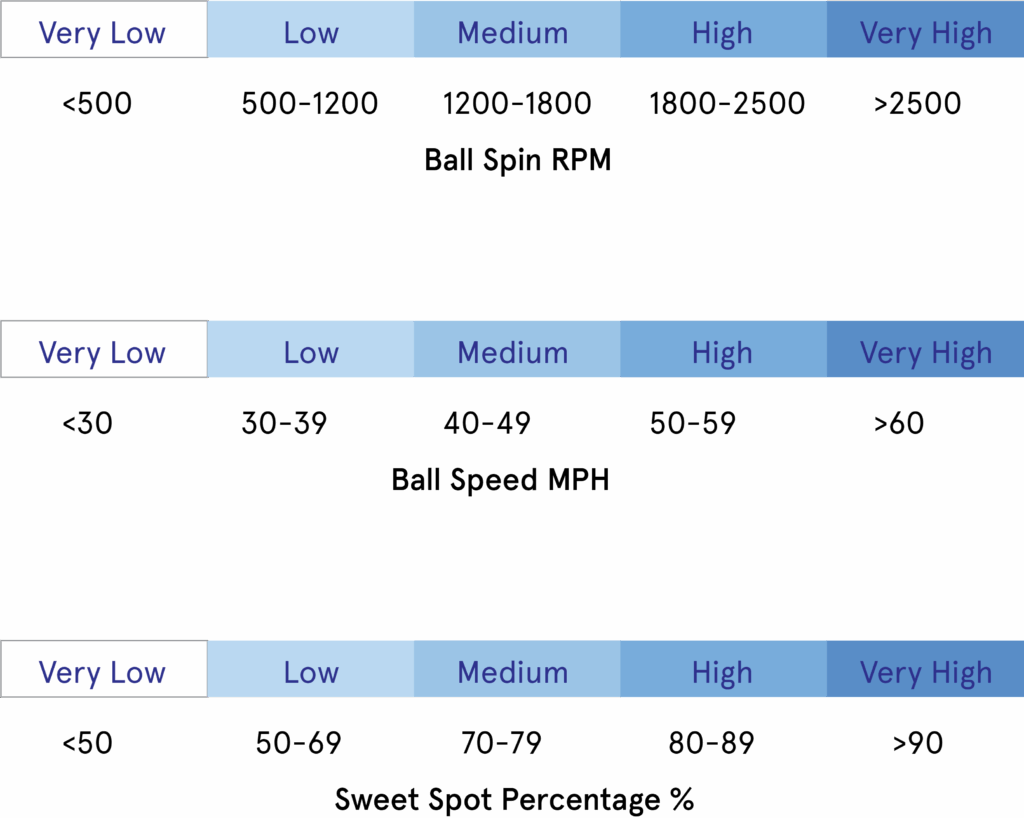
The reference ranges divide the metric overall range into five sub-ranges. The most desirable sub-range, the target range, is shown in deep blue, and the least desirable is shown in light blue.
For metrics that describe monotonously increasing values, such as ball spin, ball speed, or sweet spot %,the subranges correspond to Very Low, Low, Medium, High, and Very High, as shown here.
Reference Ranges Computation
The reference ranges are computed based on the metrics' statistical distribution considering different player population subgroups.
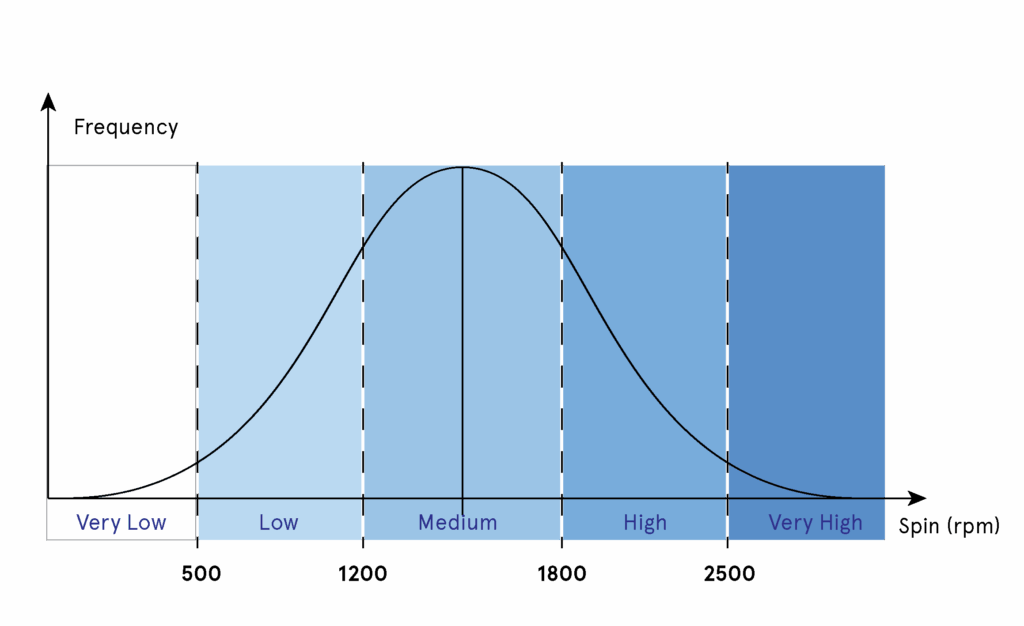
The example here shows a distribution of spin for a group of players. Spin, like many other metrics, is typically distributed following a so-called normal distribution. That means the mean value is close to the median, and the probability of low and high spin values gets lower as you move away from the average spin. For example, the likelihood of producing a very high spin (here above 2500rpm)in a general player group is low.
The five ranges from very low to very high are computed by dividing the distribution into regions with equal probability increments of 20%.
Metrics Display
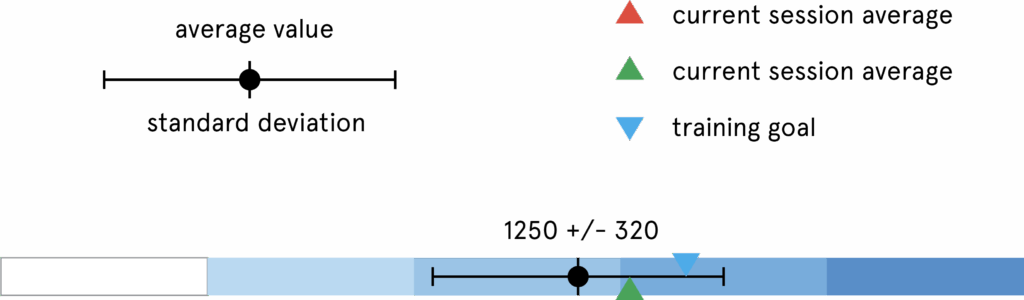
On the CueMate app, each metric is displayed in terms of its statistics (mean and standard deviation).These quantities are superposed on a blue scale (low, medium, high, very high) that makes it possible to understand where the player’s attributes fall relative to the larger player population.
Metric Reference Interpretation
The reference ranges allow the following basic interpretations:
- The average value indicates the level achieved when averaged over many repetitions.
- The location of the average within reference subregions indicates where the players' metrics fall relative to the player's subgroup.
- The standard deviation indicates the variation in the metric around its average value. It can extend across reference subregions. For example, the top spin may be medium on average, with some probability of reaching values categorized as high.
- The range within the standard deviation represents values achieved with high probability (68%,assuming the distribution is normal).
Reference Ranges – Population Subgroups
The reference ranges are adapted to each class and metric; however, the values only make sense if they are based on the skills and performance of players with similar levels and individual factors.
CueMate computes reference values for different population subgroups. The more specific the subgroup, the more useful the reference values for training.
Subgroups Overview
CueMate defines groups according to different criteria, which enable comparing the various stroke class attributes from a wide range of perspectives, including:
General population:
All the players in the CueMate ecosystem.
Skill level:
Players with the same skill rating in a stroke category (groundstrokes, volleys, serves).
Class Outcome Rating:
Players with similar outcome ranges in a class (ball speed and spin). Outcome ratings are similar to skill ratings but are defined at the level of each stroke class. They are provided for each class a slow, medium, and high.
Stroke Styles:
Different stroke techniques have different characteristic levels of outcomes and technique attributes. This type of reference is more specific than the outcome groups since it describes which range of outcomes and attributes should be expected when using a specific stroke technique.
Tennis Rating Groups:
Players with similarUSTA,UTR, and WTR ratings (if provided by the player).
Professional:
Players that are ranked (ATP or WTA 1000).
Social Groups
CueMate also enables reference groups based on social groups.
- Social Groups can be created for clubs, leagues, or simply a group of friends.
- This makes it possible to compare yourself to other players you know. However, these values are typically less useful for training.
[ADD LINK]
Using Reference Groups
CueMate assigns users to the default reference groups based on their performance and the information provided in their user profiles (USTA or WTN, UTR ratings).
Different reference groups can be selected based on skill level. This allows users to understand where they stand relative to a group of players of their level or below/above.
This enables you to gain more insights into your skills and performance. For example, users can challenge themselves by viewing how specific metrics would have to change to belong to the next skill level. Conversely, users can boost their confidence by viewing their metrics relative to the lower level.